Huddle Up Group’s inventive tourism tool helps facilities and destinations keep score of their strengths, weaknesses and opportunities
One appealing aspect about sports is typically, each competition concludes with a victor and the vanquished.
In the world of sports tournaments though, the measuring stick as to why destinations achieve success or failure is considerably cloudier.
The Huddle Up Group, a sports tourism industry consultancy, has made impressive strides toward providing destinations and facilities a more accurate measurement of their strengths and weaknesses, giving them a scoreboard of sorts.
In 2019, the Huddle Up Group introduced a first-of-its kind tool, called the Sports Tourism Index, which was developed to help destinations evaluate their position in the sports tourism market in three areas: destination strengths (the index analyzes the strengths of a community as a host destination for sporting events), opportunities (it identifies areas of opportunity as a sports tourism community) and competitive analysis (it determines a destination’s standing relative to its competitive set).
“The Sports Tourism Index is Huddle Up Group’s proprietary tool that we developed essentially to help destinations keep score,” said Eric Olson, director of Huddle Up Group. “The genesis of this was from a conversation that Jon Schmieder (founder and CEO of Huddle Up Group) and Caroline Allman (director of the Huddle Up Group), had coming home from visiting a client who was pressing them on how to understand where they stack against their regional and national competition and having a measuring stick of how they’re doing competitively other than room nights.
“More and more we were hearing clients say it’s more than just economic impact and room nights,” Olson added. “What are some of the other metrics that we can use to formulate and drive conversations with our local constituent base as well as use it to inform decision-making on how we’re going to go after specific and targeted events that make the best sense for our community.”
Birth of a new tool
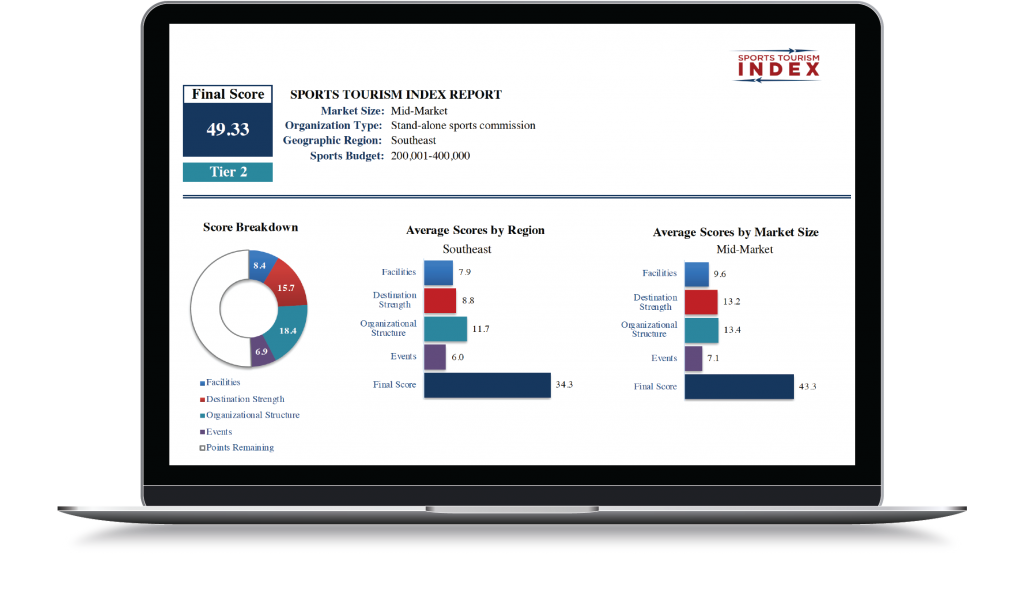
The index was built with the input of numerous rights holders and event planners utilizing national best practices in the four measurement areas that make up the index: facilities, destination strength, organizational structure and events. Once completed, the index provides the user with an analysis summarizing the organization’s scores across the four areas of measurement along with a total score. Each measurement area consists of 25 points that add up to 100 for the total score.
The tool measures different areas so stakeholders can understand destinations’ positions within the marketplace. Huddle Up Group surveyed more than 300 rights holders and asked them specific questions about when they are shopping a destination or market, what are the things they are looking for that will distinguish them from the rest. These categories of measurement were developed by rights holders based upon what they are looking for.
“We really got into the minutiae and it took probably eight months to build before we could even Beta test it,” Schmieder said. “We went to our advisory board, and we asked them to go behind the wall and test the system and try to break it. We found some holes, fixed those and we soft rolled it out at Sports ETA last year. The tool has 1,900 columns in a spread sheet that responses feed into. That’s how many different variable responses can be tabulated based on what data you put in.”
With two report options, the index takes an in-depth look at a community and benchmarks the destination against its competitors within three primary categories: market size, region and organizational structure. In addition, high-level recommendations are provided along with a breakdown of how a destination compares to the industry averages. The strengths and weaknesses of a community provide insights for potential growth and the opportunity to improve.
Valuable assistance during a pandemic
As the COVID-19 virus inflicted severe damage on the sports tourism industry, the Huddle Up Group utilized the index to help the industry move forward by offering a free baseline version of the index.
“When things shut down with COVID, we checked in with our partners and asked how we could help the industry sustain and be in a position for rebound,” Olson said. “We decided intentionally to start pushing the Sports Tourism Index out to state associations and marketing it out to destinations as a free service. If the destination took the time to put the data in there, we would invest the time to get the data analyzed so they could utilize it during a rough time.
“(The Sports Tourism Index) essentially gives them a tool to form some conversations like ‘maybe we can pivot and won’t look on a national spectrum but maybe a regional spectrum,’” Olson said. “Perhaps they are having some challenging conversations about the budget cycle for 2021 and this can show the value sports tourism or events have as they relate to other tourism strategies. It provided individuals another data point that was specific to them but also provided them a comparison to their peers.”
Case study
“We were thankful for Huddle Up Group’s Sports Tourism Index,” said Josh Dill, director of sports events for Visit Frisco. “Not only were we able to share our results with our board and city leadership to show our value, but it was a catalyst for conversations around facility development and availability.
“It provided an unbiased and objective look at all aspects of sports tourism within our destination that key stakeholders appreciated and trusted,” Dill added. “In my opinion, the main goal for any kind of tourism operation is relevancy. Too often we end up dedicating more resources to proving our value to stakeholders than we do to actually doing the things that provide value. Tools like the Sports Tourism Index and Destinations International’s economic impact calculator give legitimacy to the impacts that sports tourism has on communities and allows tourism professionals to dedicate their time to true destination-enhancing activities.”
Badge of Honor
Based on the index’s analysis and the total score it doles out, a destination will have the opportunity to earn Sports Tourism Index designations for the four measurement categories and each facility submitted.
“We can specifically see what makes up (a client’s) 25 points or lack of 25 points and not only compare them on apples to apples market size, but also their region,” Olson said. “We can make recommendations if there are opportunities for organizational restructuring or funding.”
“When the report is finished, it automatically rates all of the facilities at that particular destination and it gives them a score based on where they stand nationally,” Schmieder said. “It gives them a Platinum (Top 10 percent), a Gold (Top 20 percent), or a Silver (Top 30 percent) or Bronze (Top 40 percent) rating. Or no rating at all for each of those elements. You could be a gold-rated city with a platinum organization and have your venues all over the map.”
Given the uncertain times, the data accumulated by the index could be helpful for destinations and sports facilities days, months and years down the line.
“As more destinations of sizes and shapes enter their information, the data becomes smarter,” Olson said. “It’s a great way to see how you are standing in almost a real-time fashion. It will be really interesting a year from now when we look at the data from this point in time to see organizationally how budgets have changed. How staffing has changed, what kind of events they are hosting and what changes have taken place in the industry.”
Finally, a way to keep score in sports tourism.
By Jason Paha